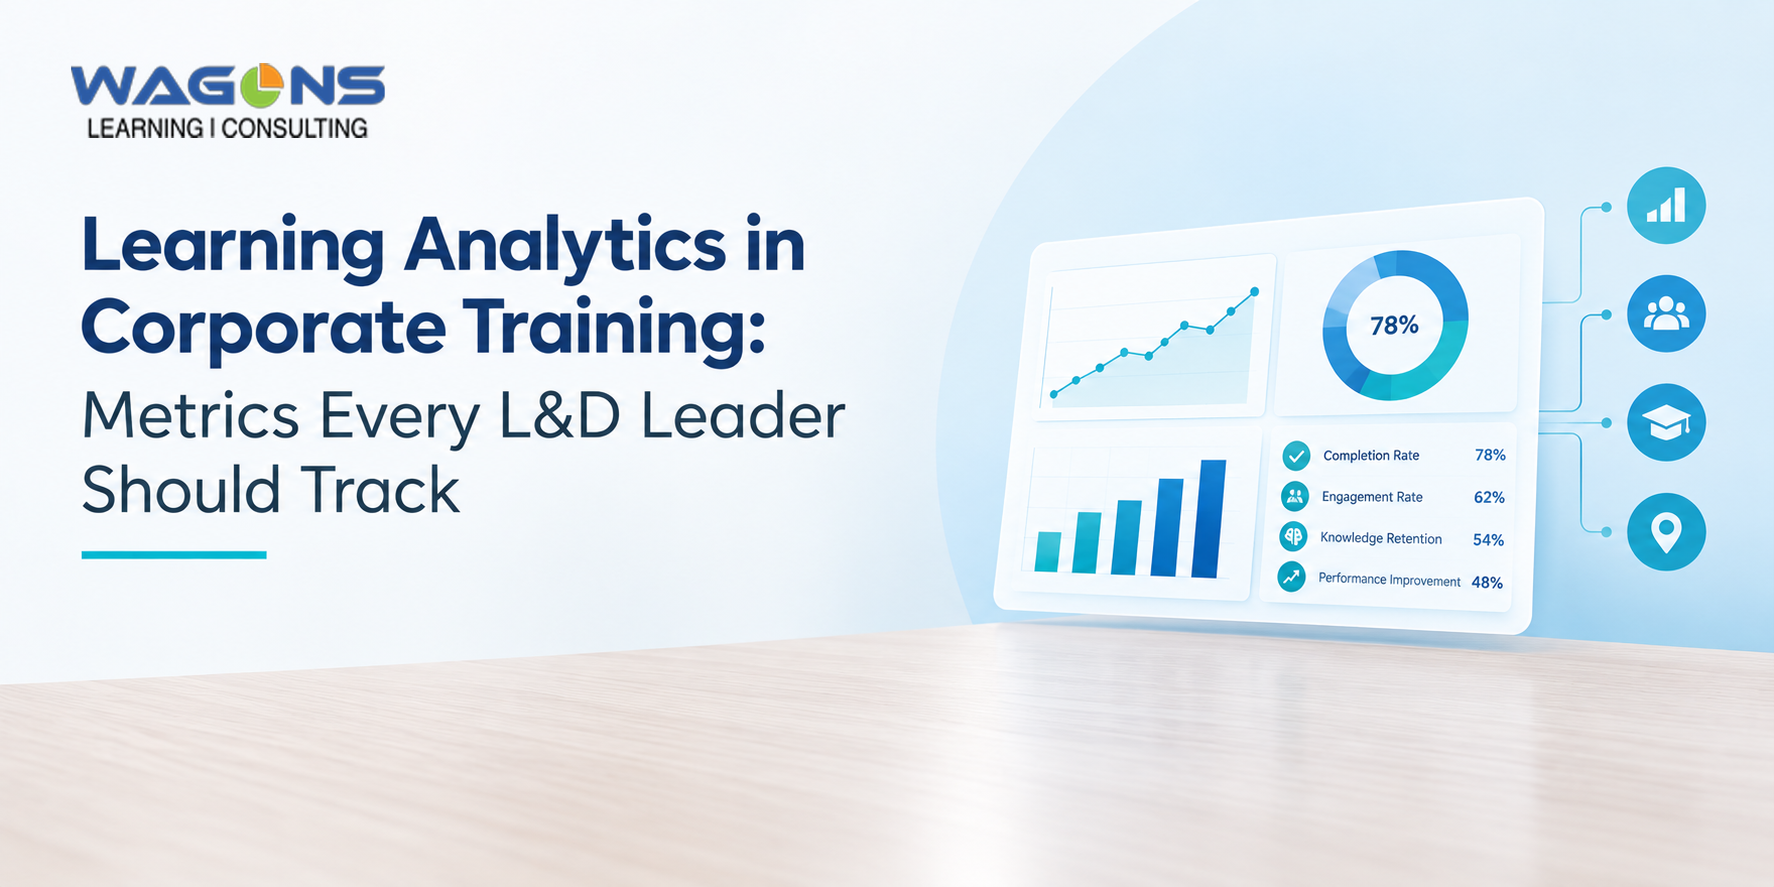
In enterprise organizations, Learning and Development departments face an escalating credibility challenge. While global business leaders recognize continuous upskilling as vital for digital transformation, corporate boards and CFOs demand verifiable proof of impact. For decades, training evaluation was confined to post-course feedback forms, attendance registers, and LMS login counts. However, vanity metrics do not demonstrate behavioral change, operational efficiency, or financial returns.
Implementing advanced learning analytics transforms scattered training data into actionable organizational intelligence. Instead of asking, “How many employees completed the course?”, strategic L&D leaders use learning analytics in corporate training to answer: “Which specific training interventions accelerated time-to-proficiency, reduced on-the-job error rates, and directly moved departmental KPIs?“
This comprehensive guide delivers an executive framework detailing the core employee training metrics modern organizations must track, how to architect an operational L&D analytics dashboard, and how to translate raw learning data into strategic business decisions across India, the UAE, and global enterprise hubs.
Quick Summary: What is Learning Analytics in Corporate Training?
Direct Definition: Learning analytics in corporate training is the systematic collection, measurement, analysis, and reporting of data generated during workplace learning activities. Its objective is to evaluate learner engagement, diagnose capability gaps, optimize instructional design, and correlate employee skill progression directly with enterprise business outcomes.
Moving Beyond the Vanity Metric Trap
The traditional approach to measuring workplace learning relies almost exclusively on activity tracking. These surface-level numbers create the illusion of progress while masking operational capability deficits.
| Vanity Metrics (Traditional) | Value Metrics (Modern Analytics) |
| Total course enrollments | Drop-off velocity and friction points |
| Completion percentages (checkboxes) | Demonstrated pre/post skill delta |
| “Smiley sheet” satisfaction surveys | Time-to-proficiency (TTP) reduction |
| Raw total learning hours logged | On-the-job operational error rates |
| Static attendance headcounts | Business KPI correlation and net ROI |
Modern enterprise analytics abandon vanity indicators in favor of four analytical dimensions: Descriptive (what happened), Diagnostic (why it happened), Predictive (what will happen next), and Prescriptive (what intervention should be triggered).
Best 4 Evolutionary Stages of Learning Analytics Maturity
Enterprise organizations progress through four distinct analytical stages as their technology stack and data literacy mature:
Stage 1: Descriptive Analytics (The Operational Baseline)
Tracks historical activity: logins, module completion rates, and average quiz scores. It informs HR whether mandatory compliance quotas were reached, but offers zero insight into whether capability improved.
Stage 2: Diagnostic Analytics (Isolating Friction)
Examines the why behind learner behavior. By analyzing question-level drop-offs, time spent per screen, and repeated test failure points, instructional designers identify whether an assessment question was ambiguous or a simulation was excessively complex.
Stage 3: Predictive Analytics (Forecasting Performance)
Leverages historical performance data and machine learning to forecast future outcomes. For instance, predictive models identify which onboarding cohorts are likely to struggle in live sales calls or which plant-floor operators risk safety lapses.
Stage 4: Prescriptive & Skills Intelligence Analytics (Actionable Optimization)
The pinnacle of modern L&D. Automated platforms dynamically recommend specific microlearning interventions, suggest peer coaching, or route customized content to close verified capability gaps before business performance suffers.
The Core L&D Metrics Framework: What Leaders Should Track
To avoid dashboard clutter and analytical paralysis, L&D executives organize their employee training metrics into four functional tiers:
| Measurement Tier | Strategic Focus | Essential Metrics to Track | Enterprise Business Objective |
| Tier 1: Engagement & Velocity | Learner attention & adoption | Active Learning Ratio, Drop-Off Velocity, Screen Interaction Depth | Optimizes instructional design; eliminates disengagement and content friction. |
| Tier 2: Knowledge & Assessment | Cognitive mastery & retention | First-Time Pass Rate, Assessment Score Delta, Longitudinal Decay Rate | Verifies genuine knowledge transfer; counters the Ebbinghaus Forgetting Curve. |
| Tier 3: Capability & Behavioral Application | On-the-job skill transfer | Time-to-Proficiency (TTP), Manager Observation Rubric Scores, Simulation Accuracy | Confirms that learned theory is translated into daily physical or digital execution. |
| Tier 4: Commercial & Business Impact | Bottom-line organizational ROI | Customer Escalation Rates, Sales Conversion Lift, Scrap/Defect Reduction, Retention | Proves the financial return of L&D initiatives to executive board members and CFOs. |
Tier 1: Learner Engagement & Interaction Velocity Metrics
Engagement data must be evaluated as an indicator of instructional effectiveness, not learner compliance:
1. Active Learning Ratio (ALR)
- The Calculation: (Number of Employees Engaging with Optional or Self-Directed Modules / Total Workforce) * 100.
- The Diagnostic Value: Excludes mandatory compliance courses to reveal genuine organizational learning culture and self-motivated curiosity.
2. Drop-Off Velocity Point
- The Calculation: Timestamp or screen number where learners exit or abandon a learning module before completion.
- The Diagnostic Value: Pinpoints exact instructional bottlenecks (e.g., an overlong video or confusing simulation) that cause cognitive fatigue.
3. Spaced Engagement Cadence
- The Calculation: Frequency of interaction with daily or weekly microlearning challenges over 30, 60, and 90 days.
- The Diagnostic Value: Demonstrates whether learning is integrated into daily workflow or treated as an occasional cramming event.
Tier 2: Knowledge Retention & Assessment Rigor Metrics
Assessment data must measure cognitive transformation, moving far beyond superficial multiple-choice scores:
1. Assessment Score Delta (Pre- vs. Post-Intervention)
- The Calculation: Post-Training Assessment Score (%) minus Pre-Training Baseline Diagnostic Score (%).
- The Diagnostic Value: Proves whether the training actually transferred new knowledge or if employees already possessed the skill before taking the module.
2. Longitudinal Knowledge Decay Rate
- The Calculation: Score on an unannounced micro-assessment delivered 30, 60, and 90 days post-course compared against the initial passing grade.
- The Diagnostic Value: Measures how rapidly critical knowledge decays in the absence of spaced repetition nudges.
3. First-Time vs. Multiple-Attempt Pass Ratio
- The Calculation: (Learners Passing on Attempt 1 / Total Assessed Learners) * 100.
- The Diagnostic Value: Highlights modules that are either excessively easy (artificially high 100% first-time pass rates) or pedagogically flawed (high repeated failure rates).
Tier 3: Skill Progression & On-the-Job Application Metrics
The critical bridge in learning analytics in corporate training is evaluating behavior transfer to the workplace:
1. Time-to-Proficiency (TTP)
- The Calculation: Calendar days required for a learner (or new hire) to reach standard baseline operational productivity after finishing a program.
- The Diagnostic Value: Directly measures the operational efficiency of the learning curve; shaving 10 days off TTP across 500 sales reps generates massive commercial value.
2. Behavioral Application Score (Manager Rubrics)
- The Calculation: Standardized 1-to-5 point observational rubrics completed by direct managers at 30 and 60 days evaluating specific demonstrated behaviors on the job.
- The Diagnostic Value: Eliminates self-reported bias by leveraging direct supervisory observation of floor habits, customer communication, and SOP adherence.
3. Simulation Decision Accuracy
- The Calculation: Percentage of correct, branching decisions executed inside virtual sandbox environments (e.g., handling synthetic customer escalations or identifying data breaches).
- The Diagnostic Value: Measures employee readiness to perform under pressure before granting access to live systems or real clients.
Tier 4: Business Performance & Financial Correlation Metrics
C-suite leaders evaluate L&D through commercial operational performance:
| Business Sector | L&D Program Focus | Correlated Business Metric | Measurable Commercial Impact |
| BFSI & Banking | Branch Relationship Manager Upskilling | Average Deposit Account Balance & Cross-Sell Ratio | 18% lift in cross-sell conversion rates within 60 days. |
| Retail Enterprises | Floor Associate Sales & Objection Handling | Average Basket Value (ABV) & Units Per Transaction (UPT) | 12% increase in average ticket size during weekend shopping peaks. |
| Manufacturing Plants | Shop-Floor Visual SOP Calibration | Defect / Scrap Rejection Percentage & LTI Rate | 30% reduction in assembly rework costs across Tier-2 facilities. |
| B2B SaaS / IT Services | Customer Support Technical Mastery | First-Contact Resolution (FCR) & Ticket Escalations | 25% drop in tier-3 senior engineering escalation tickets. |
Designing an Executive L&D Analytics Dashboard
An effective L&D analytics dashboard is role-specific. Attempting to build a single dashboard for trainers, HR managers, and the CFO creates visual clutter that nobody consults.
Dashboard View 1: The Executive (C-Suite & Board)
- Key Questions Answered: What is our enterprise capability density? Where are our compliance liabilities? How does learning correlate with net productivity and retention?
- Key Widgets: Capability progression heatmaps, organizational compliance audit readiness, and net training cost per productive employee.
Dashboard View 2: The Department Head (Functional Business Leaders)
- Key Questions Answered: Which teams are lagging behind in technical capabilities? Are my team leads coaching effectively? How fast are new hires becoming billable?
- Key Widgets: Time-to-proficiency tracking, manager observation completion scores, and functional skill gap indices.
Dashboard View 3: The Instructional Designer (L&D Operational Specialists)
- Key Questions Answered: Which module screens are causing learner drop-offs? Are assessment questions statistically valid? Which content assets need a refresh?
- Key Widgets: Screen drop-off heatmaps, question discrimination indices, and learner feedback sentiment analysis.
Building an Analytics Ecosystem: Internal vs. Managed Training Services
Enterprises evaluating their analytics infrastructure must weigh the resource demands of building an in-house analytics pipeline versus leveraging a Managed Training Services partner:
| Evaluation Factor | In-House L&D Analytics Build | Managed Training Services (MTS) Framework |
| Data Engineering Infrastructure | High burden; requires building custom SQL pipelines to join LMS, HRMS, and CRM data. | Turnkey; pre-integrated analytics engines that harmonize cross-platform learning data instantly. |
| Skill Gap Intelligence | Manual; HR specialists spend weeks exporting and formatting static Excel sheets. | Automated; native AI-driven capability mapping that updates skill benchmarks dynamically. |
| Dashboard Customization | Slow; dependent on internal IT or BI team availability for dashboard updates. | Agile; purpose-built L&D dashboards tailored to C-suite, managers, and operational teams. |
| Benchmarking & Industry Standards | Internal-only; lacks context on how company capabilities compare against competitors. | Broad; comparative benchmarking against industry standards across BFSI, Auto, and Pharma. |
| Operational Overhead | High fixed costs in data analyst salaries and third-party visualization licenses. | Predictable, variable operating model bundling analytics, content, and LMS administration under one SLA. |
Frequently Asked Questions (FAQs)
What is learning analytics in corporate training?
Learning analytics in corporate training is the measurement, collection, analysis, and reporting of workplace training data to understand and optimize learning effectiveness and correlate employee development with enterprise business results.
What are the most important employee training metrics to track?
The most critical metrics include Time-to-Proficiency (TTP), Pre- and Post-Training Assessment Score Delta, Active Learning Ratio (ALR), Manager Behavioral Observation Scores, Longitudinal Knowledge Decay Rates, and direct operational business KPIs (such as sales conversion, customer error reduction, or scrap rates).
How does an L&D analytics dashboard differ from standard LMS reporting?
Standard LMS reporting provides static, backward-looking activity metrics (such as course completion percentages and login counts). An L&D analytics dashboard synthesizes diagnostic, predictive, and operational performance data, providing real-time insights into capability progression, learning bottlenecks, and commercial ROI.
Can learning analytics prove training ROI?
Yes. By establishing baseline operational metrics before a training intervention, measuring knowledge acquisition through rigorous assessments, tracking on-the-job behavioral application over 30 to 90 days, and comparing performance between trained and control cohorts, organizations can isolate the financial contribution of learning programs.
What technology is needed to deploy modern learning analytics?
A modern learning analytics architecture typically requires an enterprise Learning Management System (LMS) or Learning Experience Platform (LXP) supporting xAPI/cmi5 data standards, an integrated Learning Record Store (LRS), and a Skill Intelligence platform that synchronizes with corporate HRMS and CRM systems.
Transform Your Learning Analytics Training Data with Wagons Learning
Collecting thousands of course completions means nothing if enterprise capability remains unchanged. Moving from disconnected training spreadsheets to high-impact learning analytics requires an integrated technology and operational framework built for scale.
Wagons Learning delivers turnkey learning analytics in corporate training through our proprietary Skill Intelligence platform and comprehensive Managed Training Services (MTS).
We help enterprises across India and expanding business hubs in Dubai and the UAE replace vanity metrics with actionable capability mapping, custom diagnostic dashboards, and measurable business outcomes that prove the commercial value of your L&D investment.
Consult an Enterprise Learning Analytics Specialist to unlock data-driven workforce transformation today.